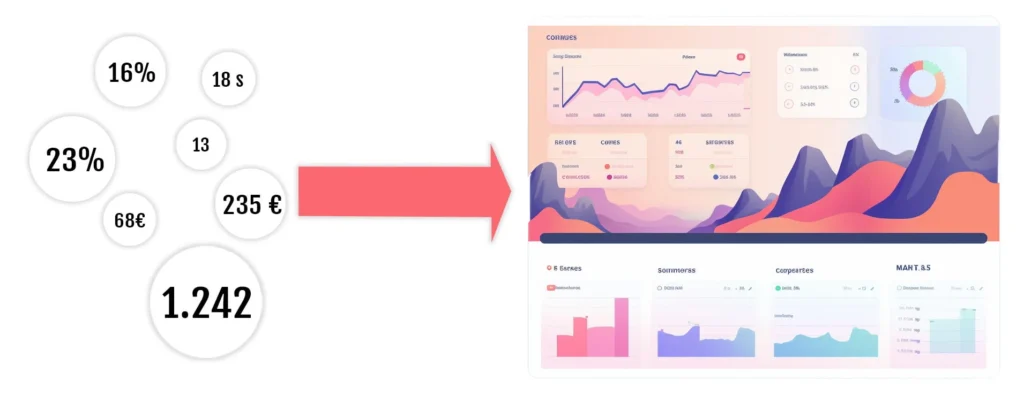
Analyze data efficiently
A good dashboard shows the key figures and values at a glance.

Identify relevant KPIs
Which KPIs are really relevant? What are secondary key figures?

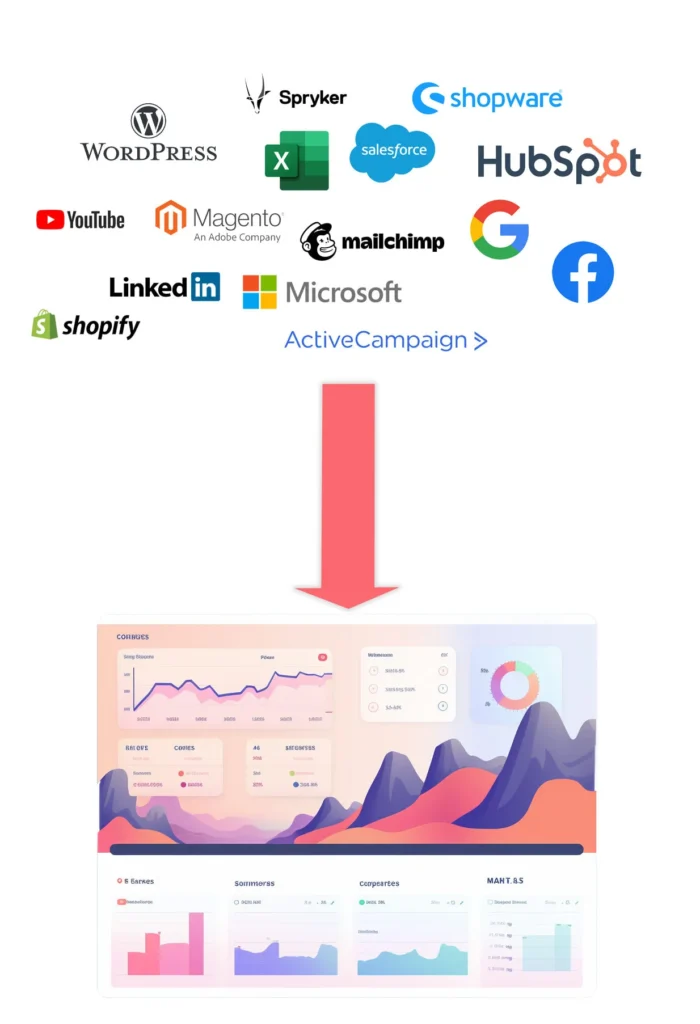
Several sources in one place
No more data chaos. All data sources clearly arranged in one place.

Transparent results for all stakeholders
No more data chaos. All data sources clearly arranged in one place.