Each test idea receives a numerical value for the three factors, which results in an overall score. This creates a comparable ranking that is intended to dampen gut feelings and loud opinions within the team. Chris Goward, founder of the CRO agency WiderFunnel, first proposed PIE in 2011 and described it in his book „You Should Test That!“ in 2012.
The term „PIE“ also occasionally stands for the academic writing method Point, Illustration, Explanation or for an open-source framework for assessment items. Both have nothing to do with the CRO framework and are not meant here.
The three factors: Potential, Importance, Ease
The three factors answer different questions and should not be mixed in scoring.
Primarily, potential and importance are often confused: Potential asks how poorly the site is performing today (How much potential does this site still have?).
Importance asks how important the page is for the business. A page can score high in one factor and low in another.
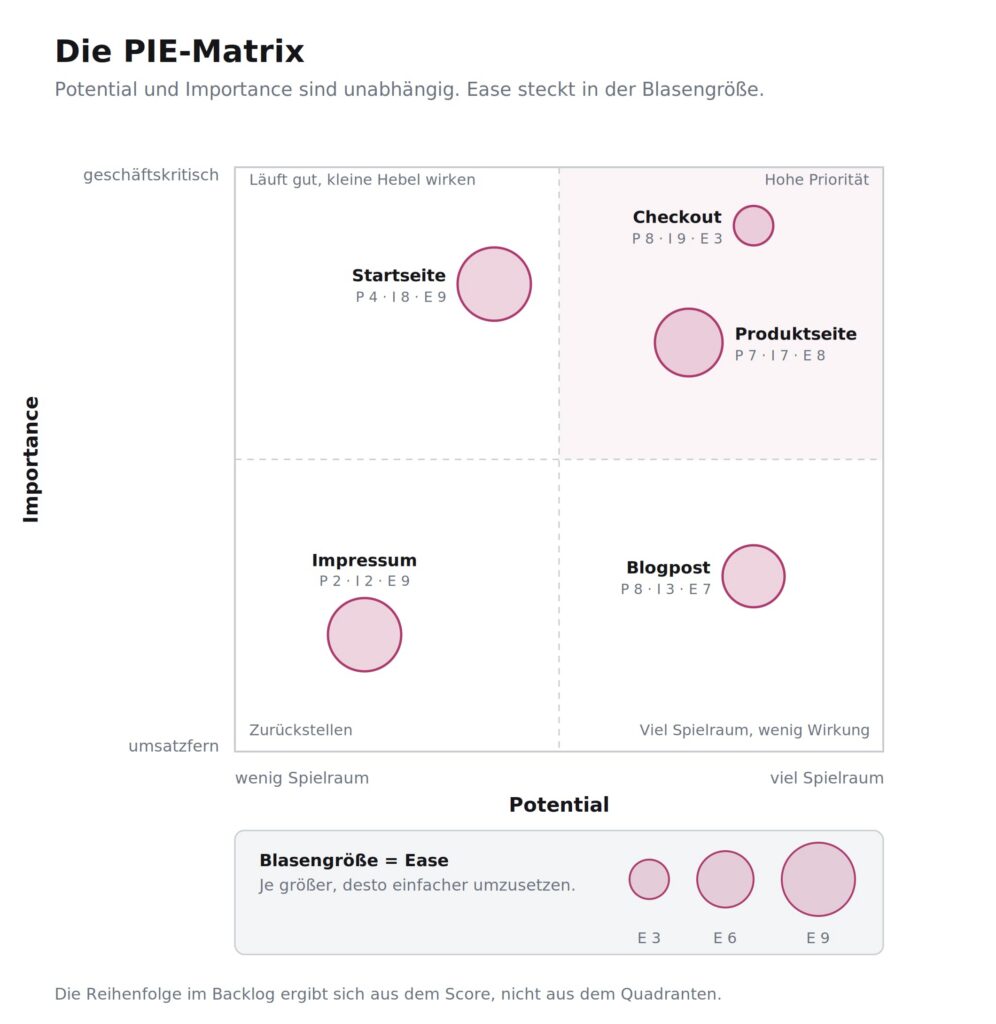
Potential: How much room for improvement does the page have?
Potential loss of how much is lost on one page and can thus be gained.
The value is based on analytics signals: high bounce rate, short session duration, low click-through rates on key elements, anomalies in session recordings, documented user issues from user research.
A page with visible friction points and poor behavioral data receives a high potential value, while a page that is already performing well receives a low one.
Without this database, potential becomes guesswork. Whoever scores without analytics, recordings, or research produces subjective assessments disguised as numbers.
Importance: How business-critical is the page?
Importance assesses the strategic value of the page to the business, not the likelihood of a test's success.
The evaluation criteria are traffic volume, revenue proximity, and position in the funnel. A checkout page with high traffic and direct revenue impact scores higher than a blog post, even if the blog post offers more room for optimization.
This precise separation is the reason why PIE does not measure confidence (like ICE), but importance. A test can have a high probability of success and still run on a page that plays hardly any role for revenue.
Ease: How easy is the test to implement?
Effort encompasses the entire process up to the live test: technical feasibility (code change, tracking adjustment), design effort, dependencies on other teams, and internal approvals. A headline change via a testing tool is easy to implement. In contrast, a redesign of the checkout involves development, design, legal, and payment, and therefore receives low scores.
Anyone who only considers the pure development time and ignores political hurdles systematically overestimates Ease and later encounters friction during implementation.
Here's how to calculate the PIE score
The calculation is deliberately kept simple. This is precisely where its strength (comparability across many ideas) and weakness (apparent precision) lie, if the scale is not cleanly anchored.
Scale and Formula: Mean or Product
A scale from 1 to 10 per factor is standard, with documented anchor points at 1, 5, and 10 for each dimension. Some teams use a scale of 1 to 5 to avoid false precision, since the difference between a 7 and an 8 is rarely justifiable in practice.
The standard formula calculates the average: PIE Score = (Potential + Importance + Ease) / 3. WiderFunnel’s original presentation uses this average. Other sources define PIE as a product (Potential × Importance × Ease). This highlights differences between ideas more clearly but is more sensitive to individual low values. The average is more stable and easier to interpret.
More important than the choice itself is consistency: whoever averages today and multiplies tomorrow makes historical scores incomparable. Choose one and stick with it.
Who is rated and how often they are re-rated
Three to five people are considered the sweet spot for scoring: enough perspectives to highlight differences in opinion, but few enough to keep meetings manageable. A single CRO lead scoring solo undermines the purpose of the framework because the negotiation of divergent assessments is eliminated.
The top 10 to 15 ideas are re-evaluated every two weeks in sprint planning, and the complete backlog is re-evaluated quarterly. A one-time scoring that then remains in place for six months misses the point: traffic shifts, revenue priorities change, and ideas further down the backlog gain or lose relevance.
PIE, ICE, or RICE?
PIE, ICE, and RICE are closely related and are often confused with one another. The functional difference lies in a single factor that makes the frameworks suitable for different situations.
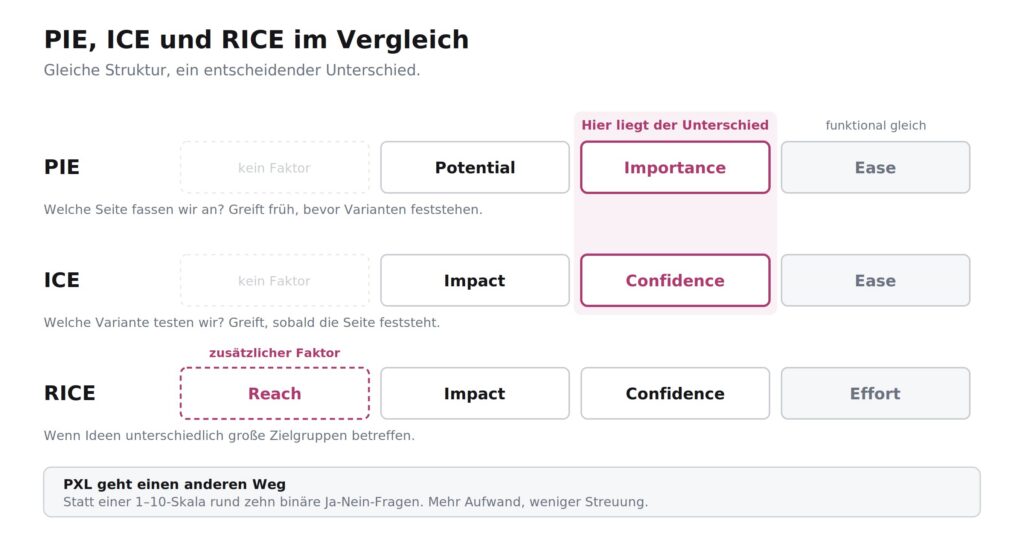
The Key Difference from ICE: Importance vs. Confidence
ICE (Impact, Confidence, Ease) was coined by Sean Ellis. The core difference to PIE lies in the middle factor: PIE's Importance describes the strategic value of the page, while ICE's Confidence describes the team's confidence that this specific variant will win.
The two frameworks work in different phases. PIE intervenes earlier and helps decide which page deserves attention. ICE intervenes later, once concrete variations have been sketched out and the team has an opinion on the probability of success. As a rule of thumb: PIE is worthwhile when the discussion revolves around „which page should we tackle?“, and ICE when the page is fixed and decisions are made about specific hypotheses.
When RICE (and PXL) Are a Better Fit
RICE (Reach, Impact, Confidence, Effort) was developed by Sean McBride at Intercom and serves as a fourth factor to complement Reach. This makes RICE relevant whenever ideas affect target audiences of varying sizes, such as in the Product Management, where a feature can reach 5 percent or 80 percent of the user base. In traditional CRO tests on the same funnel, reach is often similar, so this additional factor doesn't make much of a difference.
PXL, developed by Peep Laja at CXL, replaces the 1-10 scale with about ten binary yes/no questions based on concrete evidence sources (e.g., „is the element above the fold changed?“ or „does analytics indicate a problem?“). The effort is higher, but the ratings are less subjective. This is useful when the team regularly has significant disagreements during PIE scoring, making the results seem arbitrary.
Using PIE in everyday life
A PIE process only works if the backlog, team, and rhythm are aligned. A practical range is 10 to 30 prioritized ideas in the backlog: with fewer than 10, there’s not enough to prioritize; with more than 30, maintenance becomes cumbersome, and low-priority ideas are rarely reevaluated and become outdated.
Before scoring, each idea needs a data foundation: an analytics excerpt for potential, revenue or traffic figures for importance, and a technical assessment for ease. Those who score without this basis are sorting opinions, not levers.
After each test, the learnings are documented, even if the result is negative. A test whose results are not recorded does not lead to learning progress, and subsequent scores will remain at the same level of knowledge. Testing platforms such as Optimizely and VWO natively support PIE in their program management modules, which simplifies backlog maintenance.
Where PIE reaches its limits
PIE is a prioritization tool, not a truth-telling mechanism. The 1–10 ratings remain subjective: What one person rates as a 7 for “Ease” is a 4 for another. Calibration using documented anchor points and team-based scoring helps mitigate this to some extent, but does not eliminate it entirely.
The framework weights all three factors equally. In practice, “Importance” is often more critical to revenue impact than “Ease”: A complex checkout test on a page with high “Importance” can yield greater results than a simple test in an area far removed from revenue but with a high overall PIE score. Those who fail to consider this prioritize quick tests over effective ones. A temporary adjustment to the weighting is possible (for example, giving “Ease” a higher weight when speed is a priority, or increasing “Potential” and “Importance” when revenue is declining), but it should be documented and not change constantly; otherwise, the framework invites gaming.
PIE is also not an economic model. It neither calculates LTV/CAC nor margin or payback, nor does it replace experiment design, sample sizing, or statistical significance testing. It is useful for relative ranking within a backlog, not for forecasting absolute revenue impact. For larger initiatives with relevant investments, an economic feasibility study belongs alongside it, not instead of PIE.
FAQ
-
Should we average or multiply the PIE values?
The mean (P + I + E) / 3 is the standard and more stable in interpretation, which is how PIE was originally defined at WiderFunnel. Multiplication spreads differences more widely and allows individual low values to heavily pull down the overall score. More important than the choice is consistency over time, so that historical scores remain comparable.
-
Which scale should we use, 1-10 or 1-5?
1-10 is common and the default in most tool implementations. 1-5 is chosen by teams that want to avoid the perceived precision of a wide scale because the difference between a 7 and an 8 is rarely cleanly justifiable. More crucial than scale width are documented anchor points at the extremes and in the middle, so all scorers understand the same thing by a 5 or a 10.
-
Who invented the PIE Framework?
Chris Goward, founder of the CRO agency WiderFunnel, first proposed PIE in 2011 and formally described it in his 2012 book *You Should Test That!*. It emerged from agency practice as a way to provide a transparent rationale for test prioritization to clients who held conflicting opinions about their own websites.
-
Does PIE only work for CRO or also for other prioritizations?
PIE was developed specifically for conversion optimization. Its underlying logic is page-centric and helps decide which page or section of the site to focus on, not which individual element to change. Methodologically, the framework can be applied to other prioritization decisions. However, for product features with highly fluctuating audience sizes, RICE with its reach factor is usually a better fit.